The Planar Shock Wave
Devesh Ranjan, (dranjan@lanl.gov)
Gregory Orlicz
B. J. Balakumar
Christopher Tomkins
Katherine Prestridge
Los Alamos National Laboratory
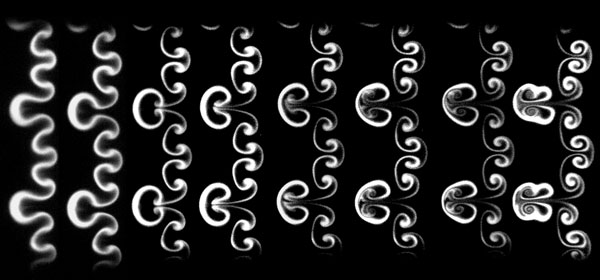
Figure 1: Single mode varicose curtain

The images show the temporal evolution of a thin fluid layer of sulfur hexafluoride gas embedded in air, after interaction with a planar shock wave of strength Mach ~1.2. The timing of each subsequent exposure after shock interaction is shown on the images. The flow evolution after shock wave passage is visualized using planar laser induced fluorescence (PLIF) with acetone vapor (mixed with sulfur hexafluoride) as the tracer. These images highlight the mixing between two different gases under extreme conditions. The mixing in these images is driven by the energy deposited by the shock wave.
Figure 2: Multi-mode varicose curtain

The images show the temporal evolution of a thin fluid layer of sulfur hexafluoride gas embedded in air, after interaction with a shock wave of strength Mach~1.2. The timing of each subsequent exposure after shock interaction is shown on the images.
This work is supported by DOE (NNSA funded lab program)
The images are previously published.
