Multi-Scale Simulations and Visualizations of Arterial Flow
Leopold Grinberg
Dmitry Fedosov
Bruce Caswell
George Em Karniadakis
Brown University,
Division of Applied Mathematics
Providence, Rhode Island
Joseph A. Insley
Mike Papka
Argonne National Laboratory
Argonne, Illinois

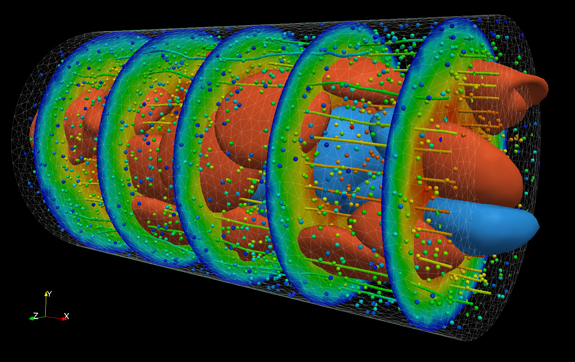
Multi-scale simulation of arterial flow.
Red and blue shapes represent healthy and diseased red blood cells;
contours represent streamwise ensemble average velocity, r
ed = high and blue = low; dots represent plasma.
The blood flow dynamics in small arteries is strongly affected by the presence of red blood cells (RBC). Healthy red blood cells have the ability to deform and even squeeze through arterioles significantly smaller than undeformed cells. However, sick red blood cells loose the ability to deform, they become stiffer and may clot small arteries and stop local blood circulation. To better understand the behavior of blood flow containing healthy and sick red blood cells, researches from Brown University modeled the cells using dissipative particle dynamics method (DPD), where a membrane of each cell is modeled as a collection of particles connected by visco-elastic spring[1]. The blood plasma was also modeled by such virtual particles.
In this figure the red cells represent the healthy RBCs, while the blue cells represent sick (malaria-infected) RBCs. Each blood cell is represented by 500 DPD-particles; small dots – DPD particles representing the blood plasma, the particles are colored with respect to their velocity. Instantaneous streamlines and contours (shown in four slices) represent the average velocity of the blood flow (red - high, and blue - low velocity).
Blood flow modeling is work is funded by NIH, grant NIH R01HL094270.
NSF funds developing visualization tools, grant NSF OCI-0904288.
References
[1] D. Fedosov, B. Caswell and G.E. Karniadakis, Biophysical Journal, Volume 98, Issue 10, 2215-2225
Reporters and Editors
Reporters may freely use this image. Credit: D. Fedosov, B. Caswell and G. E. Karniadakis (Red blood cell modeling) and L. Grinberg, J. A. Insley and M. Papka (Visualization) (2010).
